Appearance
Admin – Reporting
Use the Analytics Dashboard to understand workload, SLAs, and outcomes.
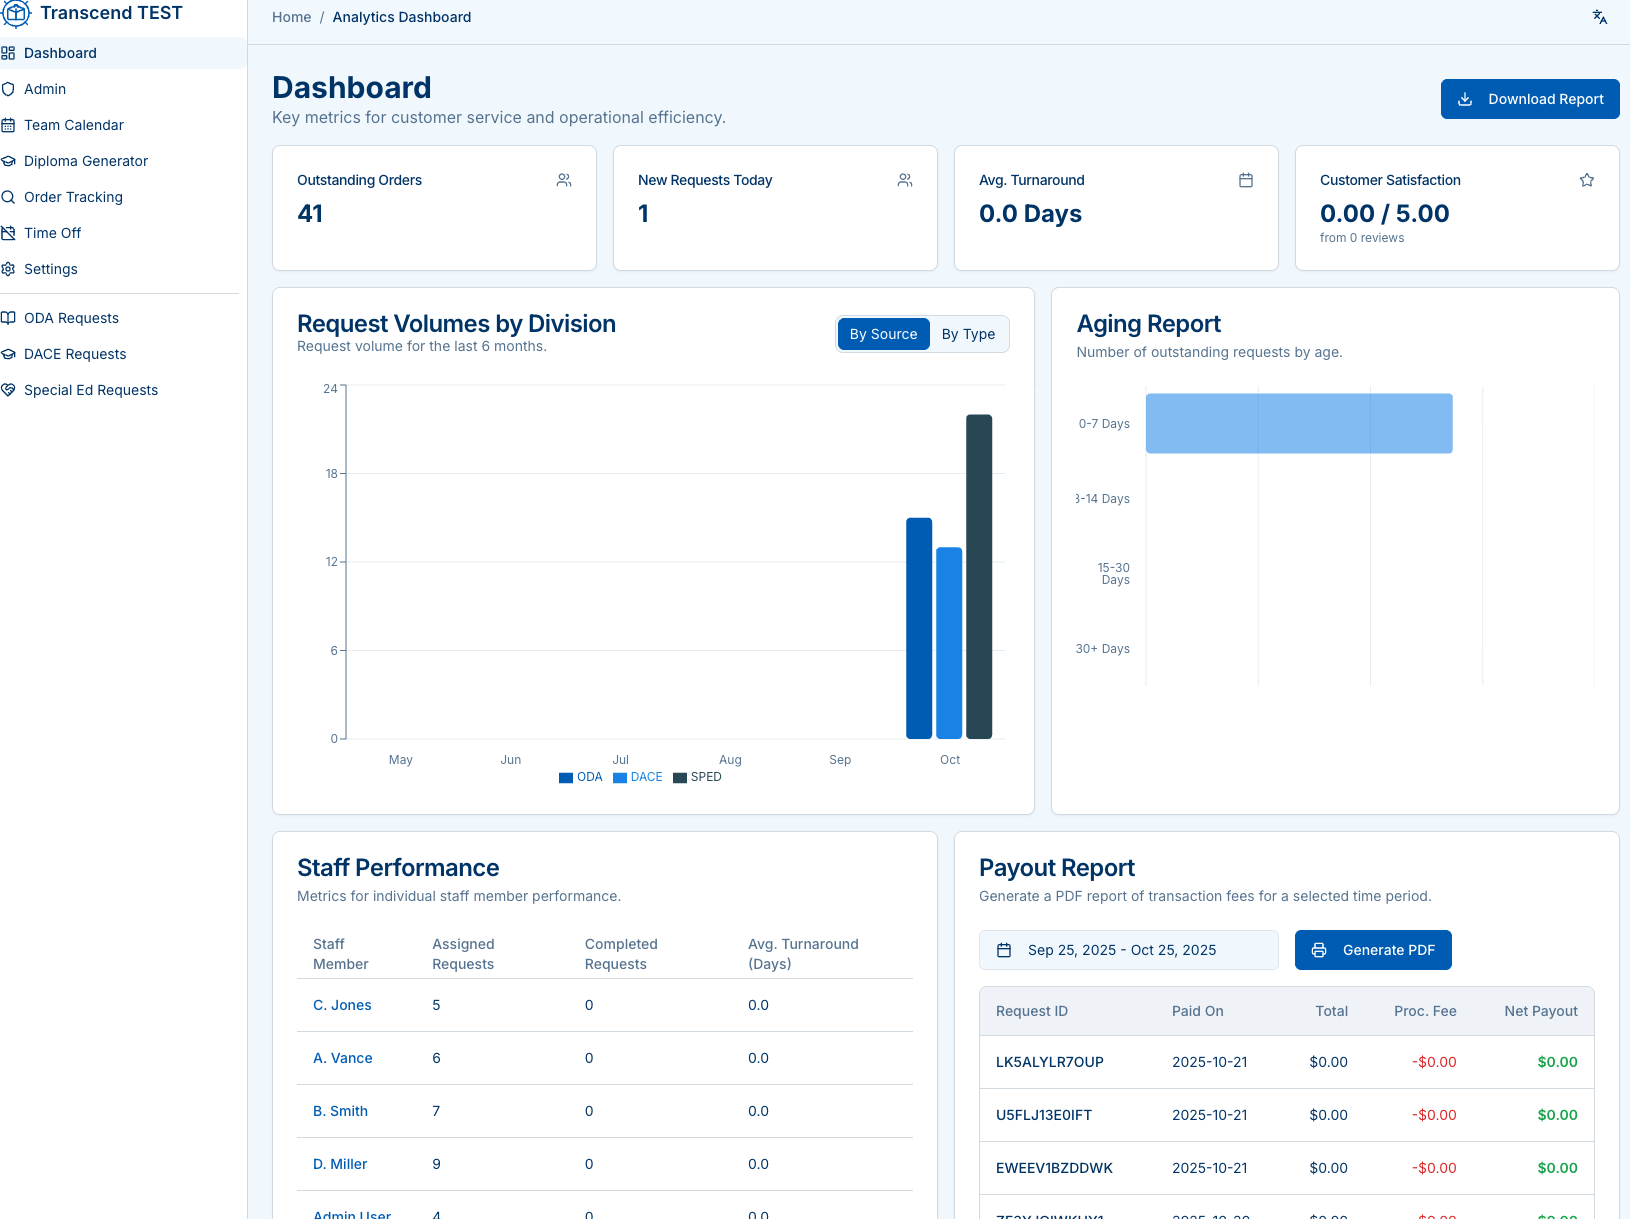
KPI cards
- Outstanding Orders — open count right now
- New Requests Today — intake volume
- Avg. Turnaround — days to complete
- Customer Satisfaction — average rating (if enabled)
Volume charts
- Request Volumes by Division (ODA/DACE/SPED) or By Type
- Use these trends to plan staffing and identify surges.
Aging report
- Buckets: 0–7, 3–14, 15–30, 30+ days
- Click through to prioritize backlogged or at-risk requests.
Staff performance
- Per-staff metrics: Assigned, Completed, Avg. Turnaround
- Use for coaching, load balancing, and recognition.
Payout report
Generate a PDF of transactions for a date range:
- Shows Paid On, Total, Processing Fee, Net Payout per request.
- Export for reconciliation or vendor settlement.